Utilizing Google search can be one of the most important tools your business can have, as it gives you access to a vast audience of potential customers. By optimizing your website for Google, you can ensure that your website is easily found by potential consumers, and that you’re getting the most out of your Google search resources.
By understanding what is being searched for on the web, you can make informed decisions about how you can optimize your website and increase website traffic. By taking the time to investigate these statistics, you can become an expert on how your users are conducting their research and gain insights into where they are spending their time online.
In this article we dive into up-to-date search engine optimization (SEO) statistics that cover everything you need to know to do well on Google search results.
Without wasting anymore time let us have a look at the round up of 116 Google search engine optimization statistics!
Google Search Statistics:
Google as we know is the most widely used search engine. Therefore, it is essential to know what is going on with Google in general and their overall search statistics.
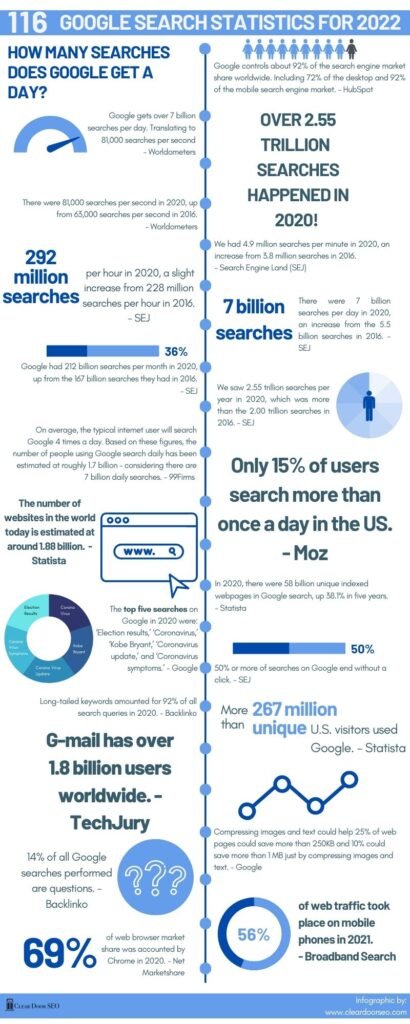
- Google controls about 92% of the search engine market share worldwide. Including 72% of the desktop and 92% of the mobile search engine market.
- Google gets over 7 billion searches per day. Translating to 81,000 searches per second.
- Over 2.55 trillion searches happened in 2020.
- There were 81,000 searches per second in 2020, up from 63,000 searches per second in 2016.
- We had 4.9 million searches per minute in 2020, an increase from 3.8 million searches in 2016.
- 292 million searches per hour in 2020, a slight increase from 228 million searches per hour in 2016.
- There were 7 billion searches per day in 2020, an increase from the 5.5 billion searches in 2016.
- Google had 212 billion searches per month in 2020, up from the 167 billion searches they had in 2016.
- We saw 2.55 trillion searches per year in 2020, which was more than the 2.00 trillion searches in 2016.
- On average, the typical internet user will search Google 4 times a day. Based on these figures, the number of people using Google search daily has been estimated at roughly 1.7 billion – considering there are 7 billion daily searches.
- Only 15% of users search more than once a day in the US.
- The number of websites in the world today is estimated at around 1.72 billion.
- In 2020, there were 58 billion unique indexed webpages in Google search, up 38.1% in five years.
- The top five searches on Google in 2020 were: ‘Election results,’ ‘Coronavirus,’ ‘Kobe Bryant,’ ‘Coronavirus update,’ and ‘Coronavirus symptoms.’
- 50% or more of searches on Google end without a click.
- Long-tailed keywords amounted for 92% of all search queries in 2020.
- More than 267 million unique U.S. visitors used Google.
- G-mail has over 1.8 billion users worldwide.
- Compressing images and text could help 25% of web pages could save more than 250KB and 10% could save more than 1 MB just by compressing images and text.
- In 2020 Chrome accounted for 69% of web browser market share.
- 56% of web traffic took place on mobile phones in 2021.
- 14% of allGoogle searches performed are questions.
- 500 keywords accounted for 8.4% of all search volume in 2020.
- Average click-through rate for desktop is 31.5% while mobile is 24%.
- People are more likely to click on a paid search ad on Google (63%) than on any other search engine including Amazon (15%), YouTube (9%), and Bing (6%).
- 55% of teenagers use voice search on Google every day.
- 55% of people that click on Google ads prefer the ads to be text ads.
- Every $1 spent on Google Ads translates to an average of $2 in revenue.
- On average keyword’s cost-per-click is around USD $0.61.
- 90% or all web pages receive zero organic traffic from Google. Whereas, about 5% receive 10 visits or less each month.
- One third of Google searches are for images and 13% of search engine results pages feature an “Image Pack.”
- Keywords on average are roughly two words long.
- The average conversion rate in AdWords across all industries is 3.75% for search and 1.77% for display.
- There are currently 192 different versions of Google Search.
- 67.6% of all clicks go to the top five organic search results.
- 50% of search queries on Google contain four or more words.
- 8% of searches performed are question queries.
Search Engine Trends
SEO is always evolving in order to allow search engines to provide its users with the highest quality results. With digital marketing experts vying for every organic search result position, it is important to understand organic SEO and the search traffic statistics related to it.
Let us take a look at some of the emerging trends with search engine optimization.
- Featured Snippets are presented for 12.3% of search queries.
- 18% of searchers enter a new query before clicking on any results for their original search.
- 3 out 4 searchers never go past the first page of search results.
- Searchers will click on more than one search result 21% of the time.
- According to Google they made over 3,620 “improvements” to search in 2018.
- Organic search results receive 94% of clicks.
- Global search engine site traffic on desktop breakdown: Google (72.4%), Bing (12.3%), Baidu (11.3%), Yahoo (1.9%).
- Organic traffic accounts for more than 40% of revenue across media and entertainment, retail, technology, internet, business services and hospitality.
- Pages ranking 1 through 3 on SERPs bolster a clickthrough rate of 36%.
- 99.58% of the time to win a featured snippet on Google, the page has to already be ranking in the top 10 SERPs.
- Brand affinity helps boost click through rate by 2-3x.
- Search engine users visit on average 3-3.5 pages every time a user enters a website from search.
- Average bounce rate for domains ranking in the top 3 spots is 49%.
- The average time spent on site for a top 10 search result is 3 minutes and 10 seconds.
- Organic search results drive 300% more traffic to websites than social media channels.
- Domains linking to a page was the leading factor in rankings on Google.
- 66% of web pages have zero backlinks pointing to them.
- Long content receives 77.2% more backlinks than short articles.
- #1 ranking pages get 5%-14.5% more dofollow backlinks from new websites each month.
- Online businesses who focus on content writing for blogs receive 97% more backlinks.
Key Search Engine Optimization Stats
- There are more than 200 factors in Google’s algorithm that influences ranking websites.
- The #1 Google SERP result gets approximately 32% of all organic traffic clicks.
- 49% of marketers believe that organic search has the best return on investment out of all marketing channels.
- Organic results on Page 1 of Google have an average of 1,447 words.
- 53% of US consumers research products using search engines before deciding whether or not to buy the particular good or service.
- 60% of websites on page 1 of Google are three or more years old.
- Links, website content, and RankBrain are the top 3 ranking factors on Google’s search results.
- 59.2% of the world’s internet traffic comes from Google’s organic search.
Voice Search SEO Statistics
With the popularity of voice search growing, we have included search statistics. If you want to ensure your content marketing is ready for this new trend these stats will get you started.
- 40.7% of all answers provided after a voice search are pulled from featured snippets.
- 70.4% of voice search results come from HTTPS websites.
- Voice search results on average have only 29 words.
- Pages employing Schema markup account for 36.4% of voice search results, compared to the global average of 31.3%.
- Google voice search results that are presented, on average has 1,199 Facebook shares and 44 Tweets.
- A 9th grade reading level is the average level for voice search results.
- Voice search results are typically 53% faster than the average load time of pages, clocking in at 4.6 seconds.
- Voice search results on Google on average contain 2,312 words.
- 3 out of 4 voice search results come from one of the top three desktop ranking pages.
- Mobile voice searches are 3x more likely to be a local search query than text searches.
- 27% of the entire world population uses voice searches on mobile devices.
- Over 1.1 billion smartphone users will use voice technology once a week out of the current 3.5 billion smartphone users.
- 20% of Google searches in the US are mobile voice searches.
Video SEO Statistics
Videos like voice search are growing incredibly fast. With the world’s second largest search engine, YouTube, dominating the video search, let us take a look at some of their SEO statistics.
- An analysis of 1.3 million YouTube Videos found a strong correlation between high YouTube rankings and the number of comments, view count, number of shares, and number of likes the video received.
- YouTube videos on the first page have an average length of 14 minutes and 50 seconds.
- 68.2% of the videos on the first page of YouTube results are HD.
- Videos that are better at getting new subscribers tend to rank higher on YouTube.
- Articles and blog posts with videos earn more backlinks and see a 157% boost in organic search traffic.
- There was no correlation found between YouTube rankings and video descriptions optimized with keywords.
Video Marketing Engagement Statistics
- 49% of marketers grow their revenue faster if they include video into their overall strategy, with 51% of marketing professionals stating videos are the best for ROI.
- 64% of consumers who watched a branded video on social media platforms ended up making a purchase after.
- 85% of all internet users in America interact with video content every month.
- Consumers love videos and 86% of them stated they would like to see more video content from the brands they love!
How Many Videos Are On YouTube?
- There are over 5 billion videos on YouTube coming from 50 million unique users.
- There are over 500 hours of video uploaded every minute on Youtube.
- People spend upwards of 40 minutes on an average during a viewing session.
- YouTube is split evenly with device views with 50% coming from desktop and mobile each.
How Many Daily Video Views Are On Facebook?
- There are over 8 billion video views a day on Facebook.
- 100 million hours of video consumed each day.
- 85% of videos viewed on Facebook are viewed with sound off.
- One out of five videos on Facebook are live broadcasts.
- Mobile devices are responsible for 98% of all views.
Local SEO Statistics
Local SEO is essential for small businesses, and with Google having a different set of ranking factors for their Google Business Profile (previously Google My Business), on Google maps and local pack in general, it is important to create an SEO strategyThese local SEO statistics can help online businesses better understand how to use these local packs to serve their specific area.
- 46% of all searches on Google are for a local business or local service.
- H1 tags are missing on 25% of small business websites.
- Yelp pages are found in the top five results of 92% of search queries containing a city and business category.
- 76% of people end up visiting the business within one day after conducting a local search.
- 28% of all local searches conducted result in a purchase.
- 46% of searches conducted have local intent.
- There are over 97 billion monthly local searches.
- 1.17 trillion local searches occur in a year.
- People using local search queries visit 1.5 billion locations every month
- 78% of people conducting a local search end up buying locally, including online and in store purchases from local businesses.
Mobile Search – Google Statistics
With Google pushing more and more for a ‘mobile-first’ approach, it is important to understand mobile usage statistics. Let’s have a look at some Google mobile SEO statistics.
- 30% of all mobile searches are location related.
- Mobile users and searches account for 58% of all Google searches.
- Organic click through rate is roughly 50% less on mobile compared to desktop.
- The first result on mobile organic listings receives 27.7% of clicks.
- 87% of smartphone owners use a search engine daily.
- 20% of queries on mobile devices are voice searches.
- When looking at the entire search engine market share for all search engines worldwide, Mobile devices make up 52.83% of all searches on search engines. Whereas 50.21% of that is mobile and 2.62% is from tablets.
- Tablets have largely plateaued in usage while desktop usage increased at the expense of mobiles in 2020.
- Mobile devices account for 62% of paid clicks on Google.
Note: Google does not provide their own data, therefore some of these statistics are estimates. However, many SEO experts believe that these estimates are actually lower than the actual figures.
- HubSpot 1, 40, 57
- Worldometers2,3
- Search Engine Land4,5,6,7,8,9,15, 42, 60, 113
- 99firms10, 103-105
- Moz11, 31, 37, 39, 41
- Statista13, 17
- Google14, 19, 28, 62, 76-78, 101, 102, 106-108
- Backlinko 16, 22 23,, 29, 32, 53, 55, 58, 59, 61, 66-74, 79-82, 84
- TechJury18
- Net Marketshare 20, 44
- Broadband Search21
- Advanced Web Ranking24
- Clutch25, 27
- Marketing Dive26
- Ahrefs 30, 38, 47, 54, 56, 63
- WordStream33, 36, 48, 85-88
- GiT Magazine34
- Zero Limit Web35
- Search Engine Watch43, 64, 75
- BrightEdge 45
- Searchmetrics 46, 51
- SEMrush 49, 50
- IronPaper 52
- Sparktoro 65, 110
- Search Engine People 83
- Omnicore Agency 89-97
- Search Engine Roundtable 98
- Fresh Chalk 99, 100
- Hitwise 109, 116
- SEOClarity 111
- Go-Globe 112
- Statcounter GlobalStats 114, 115
Key takeaways: 116 Google Search Statistics
Google continues to dominate the search market, as evidenced by its dominance. Other search engines, on the other hand, should not be overlooked. Search engines like Bing, Baidu, and others are gaining popularity.
That’s why it’s critical for businesses to target niche audiences by keeping other search engines in mind. Platforms like Facebook and Amazon, to name a few, have also maintained their growth over time. Marketers may increase their CTRs and conversion rates by understanding Google’s search trends.
Google search statistics are a goldmine of information that can be used for a plethora of reasons. The best way to use this wealth of data is by tailoring your content and site according to what people are searching for. Soon enough, you will find your traffic increasing as people start accessing quality and relevant posts on your website every single day.
In the end, it’s all up to your website’s content and optimization. You can use what you have just read and make strategic changes that will help improve the overall quality of your website.
That’s it for our list of SEO search statistics. It rounds out at 116 Google search and SEO statistics. Do you know any other great search engine traffic stats that we missed? Let us know in the comments below!